The future will reflect the past- but it won’t be the same as the past. By manipulating and changing the actual bar chart data of an instrument we can test how a system will go on a similar, but different version of history- an effort to make the past simulate the future.
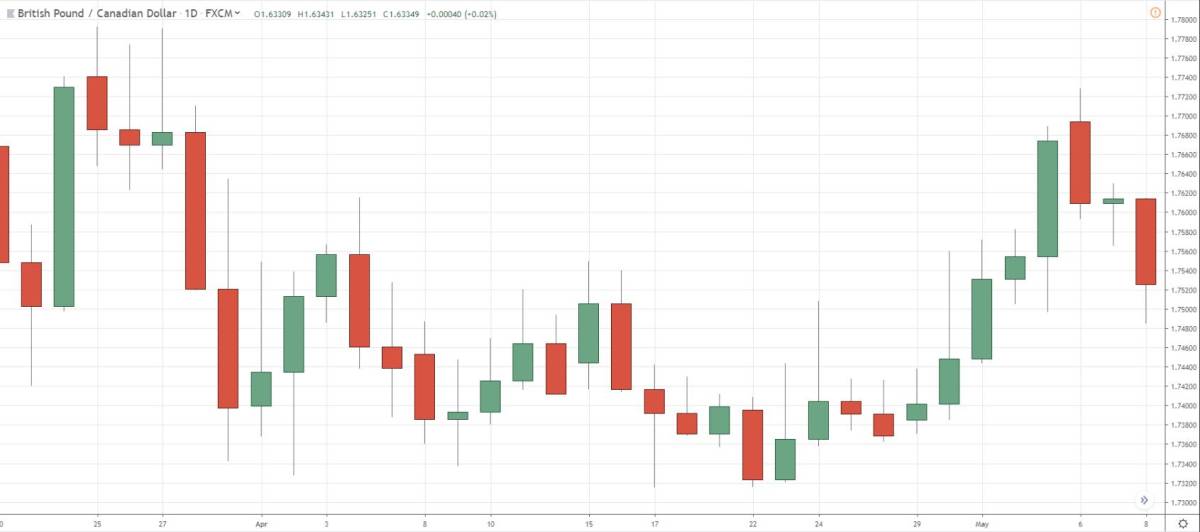
When a chart is looked at it appears like this:

We look to change this chart slightly- so that it maintains the original qualities of the instrument, but is different to test if a system can cope with the changes.
We will do one of 2 things-
- Increase or decrease the overall volatility of a bar
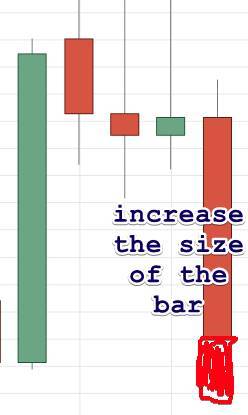
- Increase or decrease an aspect of the bar
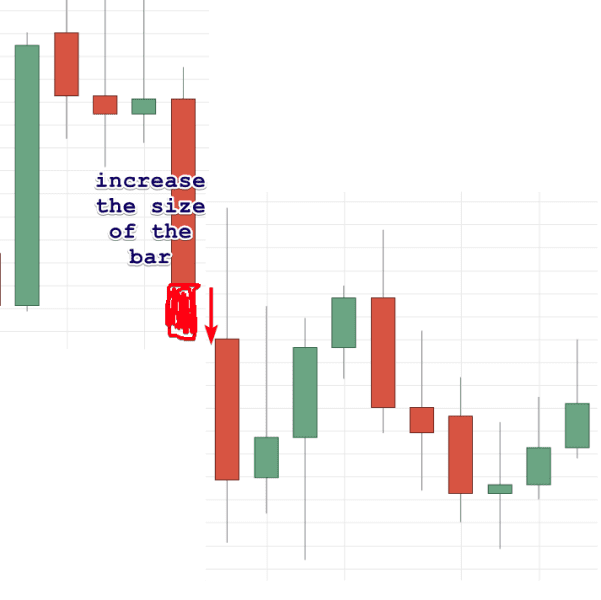
For example, we might increase the close of a bar:

Then the bar on from that will be adjusted to begin after this modified bar to keep the ongoing integrity of the data.

The same method of change and re-adjustment is done if the bar is reduced in size, or the open/high/low/close values are manipulated. When put back together a complete chart of a similar but new type is then created for the system to be tested on.
We want to see the system perform reasonably well in the similar but different market data we have created because it is a quasi-test for how it might perform in a similar but different future market.
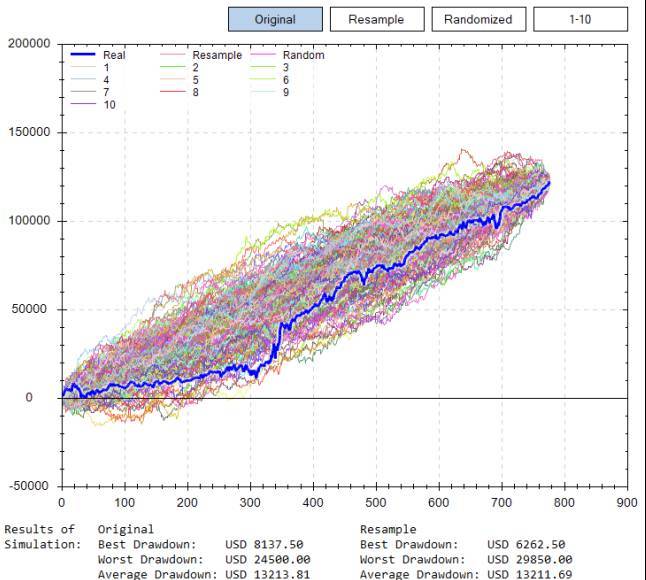
The results of creating different alternative markets results in this chart:

Like the other blogs, the original is in blue with the various different data manipulation charts in other colours. It is observed that when the chart data has slightly changed the results overall remain relatively consistent.
This is positive. Even better is that we see more alternative data permutations above our original line than below it. All indications are that this system performs consistently and robustly in a market that is different to its original one. So we can have more confidence that the system will continue to perform in the future in a different market to which it has experienced.
The past won’t repeat itself, but it could be similar. We make sure that these possible differences are tested on our systems so avoid as many unknown surprises as possible, keeping your funds safe.
Originally posted on https://www.bmams.com.au/
The post bMAMS: Using maths to make your funds safer – changing the charts first appeared on trademakers.
The post bMAMS: Using maths to make your funds safer – changing the charts first appeared on JP Fund Services.
The post bMAMS: Using maths to make your funds safer – changing the charts appeared first on JP Fund Services.


