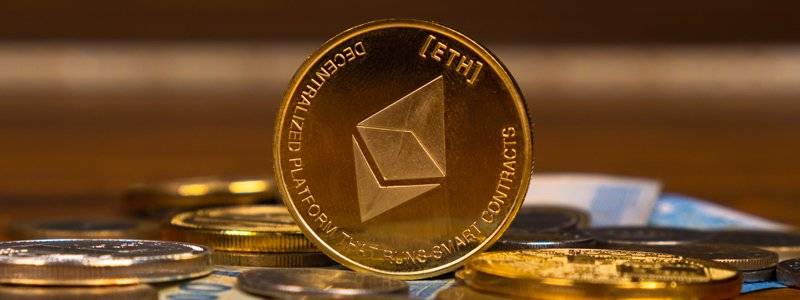
There is no better way to stay ahead of the cryptocurrency market than to stay informed. If you have some doubts or you are just unsure which digital asset is worth the investment, this weekly report is here to guide you in making the right choices.

Bitcoin (BTC)
At the start of last week, Bitcoin encountered resistance near the mid-$23,000 region. Since January 1st, the cryptocurrency has skyrocketed by 45%. During the upward trend, Bitcoin’s price has only pulled back for a day or two before continuing its climb. On January 30th, the largest single drop in market value for the month occurred, a 2.5% decline.
On Monday, January 30th, Bitcoin was trading at $23,165. Several indicators showed that the cryptocurrency was in a robust uptrend. For instance, the bears were unable to push the price below the average. The 8-day exponential moving average (EMA) provided support for the trend during the third impulsive wave, which is considered the strongest part of the rally.
On the first day of February, Bitcoin’s price showed a tight range formation after a month-long rally. This pause was observed in Ethereum and Ripple prices, but not all altcoins. Some cryptocurrencies were still surging, so investors need to be cautious as this upward trend could come crashing down.
On the second day of February, Bitcoin was trading at $23,746, a 3% increase from the start of the month. This positive move signaled potential gains to come. During January, the bulls established a swing high at $23,960. The ongoing upward trend is expected to take out the liquidity above this level and move into the $24,000 price range.
The 8-day EMA has driven the recent surge, and the 21-day simple moving average has yet to be retested during the 40% hike in January. The Bitcoin uptrend appears to be poised for further growth. A conservative target would be the $25,000 territory, resulting in a 7% increase in the current market value.
As of Thursday last week, Bitcoin was trading at $23,165. The trend remained bullish as the bears were unable to push the price below the 8-day EMA. Data from the Binance exchange API suggests that the bulls are still in control, with a strong candle from January 12th and an influx of $454,000 in transactions.
Over the last two weeks, Bitcoin has been hovering around $23,000. Initially, it attempted to break through the $22,800 resistance posed by the Momentum Reversal Indicator’s state trend resistance level and the breakout line. In the second half, it broke through but has yet to confirm a successful flip.
Investors can choose to be optimistic and expect the bull rally to continue, but the technical indicators show that momentum has been declining since January 14th. The only thing preventing Bitcoin’s price from plummeting is the $22,800 support level. While a bearish outlook makes sense, investors need to be aware of the possibility of a sudden surge in buying pressure. The ongoing rally was a surprise that caught many bears off guard, so Bitcoin’s price could make another attempt at $25,000. If it flips this psychological level into a support floor, it would invalidate the bearish thesis and trigger buying from sidelined investors, potentially leading to a rally to the next psychological level at $30,000.

Ethereum (ETH)
The Ethereum price saw a strong drop after a 4% increase during the last Sunday of January. The bears fully reversed the move, setting the opening price at $1,572, causing a 5% decrease on the day. As previously noted, the $1,610 level is crucial for ETH’s upward trend, and failing to maintain the price above this level could lead to a significant downturn.
Ethereum was valued at $1,583 on January 30th. Like Bitcoin, the volume indicator favored the bulls. However, the bears succeeded in closing the daily candlestick below the barrier during previous upward movements.
Ethereum showed weakness before Bitcoin did. For example, ETH topped out and reversed on January 21st, while this happened for Bitcoin a week later. Nevertheless, a break below $1,512 would confirm the start of a bearish trend, potentially lowering the Ethereum price to support levels of $1,429 and $1,331.
On the second day of the week, Ethereum displayed signs of bullish strength that should not be ignored. The decentralized smart contract token rose by 4% that day. The analysis of the thrust candle from the previous congested area near $1600 shows that Ethereum is gaining strength in anticipation of a bull run.
As of Wednesday last week, Ethereum was priced at $1644.50. The 21-day Simple Moving Average (SMA) was producing a bullish crossover with the 8-day EMA. The last time this crossover occurred was on January 4th, when Ethereum traded at $1211, resulting in a 40% increase to January’s high of $1679.26.
Last Friday, Ethereum hit a new yearly high at $1,714, but some profit-taking has since taken place. Despite some bearish influence, the overall trend remains intact. Ethereum was trading at $1,666, above the 8-day EMA and 21-day SMA, indicating a healthy upward trend. The volume indicator also favored the bulls, but the market remained stagnant as traders watched for key levels for potential sell-offs.
Going into the new week, Ethereum is following Bitcoin, but if the bearish trend starts, ETH will decline. Regardless of the bearish outlook for Bitcoin, if Ethereum can surpass the $1,677 level, a push to $2,000 is likely. If this level becomes a support floor, the decline can be reduced, and instead, a climb to $2,730 could be in store.

Ripple (XRP)
On January 30, the digital token was down 3.5% on the day as the bears accomplished their first breach of the 21-day simple moving average (SMA). XRP price exchanged hands at $0.3995.
On the second day of the week, Ripple price followed the Bitcoin and Ethereum duo but at a much slower pace. As a result, XRP price rallied 30%. After forming a local top at $0.433, the remittance token pulled back to retest the $0.400 to $0.381 support barrier.
XRP price joined the bullish surge in the crypto ecosystem on February 1, up 4% on the day. The Ripple price retraced back into the previous $0.41 congestion zone. It was believed that if XRP continued to move in unison with Bitcoin and Ethereum, there was a chance for the bulls to challenge liquidity above the January high of $0.433.
XRP price traded at $0.411 at mid week. The recent pivot point at $0.381 on January 31 landed at the 38.2 retracement level, a common stopping ground for consolidations during strong uptrend rallies. So long as XRP stays above the halfway point near $0.361, the potential for a larger macro upswing lingers.
Going into the new week, Ripple price is back to retesting the $0.400 to $0.381 support zone after the initial decline. A daily candlestick close below $0.381 will lead to a breakdown of this structure, signaling the start of a downtrend. In such a case, Ripple price will revisit the temporary support level at $0.367. A spike in selling pressure will send the remittance token to the $0.337 and $0.316 barriers.

Cardano (ADA)
The Cardano price saw increased volatility in the final days of January. The bulls were dominant as the price rose in a staircase pattern, reaching a new monthly high of $0.391 on January 29. The next day, the bears caused the largest 24-hour decline of the month, a 7% reduction in market value. Cardano traded at $0.370 on January 31.
In the last trading hours of Wednesday, Cardano was expected to increase by 10%. Despite the overall bearish market, Cardano managed to rise nearly 6% over three days, trading at $0.4 on Thursday. The smart contract rose 70% since January 1, reaching a new high of $0.4138 on Friday. Despite negative market sentiment, Cardano’s price remained strong and traded at $0.399, up 7% from the morning. It also broke out of a descending trend channel, which had been a key factor in its price action since 2021.
On February 2, Cardano established a new high for the month at $0.4125 but encountered resistance. This resistance may indicate exhaustion, but the overall outlook since December supports continued growth. If the technicals are accurate, ADA could see a larger move.
Starting the new week, Cardano is trading at $0.403. The 1-2-1-2 ramping pattern in the current uptrend suggests a potential for higher prices. This pattern occurs when the price makes higher lows and higher highs in a repetitive manner.

Solana (SOL)
Last week, the Solana price remained above the $22 mark that it regained a week prior, maintaining its uptrend. Trading at $23.91 on Monday, Solana defied the downward trend in many cryptocurrencies by continuing its upward momentum despite a slowdown. SOL could strengthen its macro uptrend that started at the beginning of the month by reclaiming $28.28, which acts as a crucial resistance level.
Reclaiming this price level would help the “Ethereum killer” recover from the losses it incurred during the FTX crash-induced collapse. Turning $28.28 into a support floor would push the price towards the next hurdle at $32.06, and breaching it would enable Solana to reach November 2022 highs of $36.90.
At the end of the week, Solana was in a consolidation phase after a dramatic display of bullish strength. In just 30 days, the centralized smart contract token rallied by 177%, leading traders to consider if the market bottom has been reached. Solana is currently trading at $24.13. The congestion near the mid-$20 zone has been ongoing for about two weeks. The 8-day exponential moving average mainly supports the back-and-forth price action, while the 21-day simple moving average has not been retested since being breached at the start of the rally.
The volume indicator favors the bulls, as there is a tapered pattern during the consolidation. This suggests that bears in the market may be retail, and that bulls in profit are holding on to their positions. The next target for traders will be the psychological $30 price level, which could lead to a 25% rise in Solana’s current market value.
The post
Digital Asset Insights
Digital Asset Insights #103
first appeared on trademakers.
The post Digital Asset Insights Digital Asset Insights #103 first appeared on JP Fund Services.
The post Digital Asset Insights Digital Asset Insights #103 appeared first on JP Fund Services.
Read More:
which item is a benefit of using the travel card
how is having a security system for your home a risk management strategy?
why is it useful to have your bank account and routing numbers when using tax preparation software?


