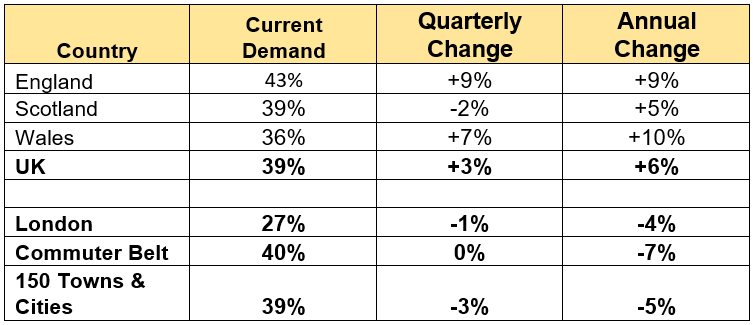
Property demand across the UK has increased to 39% in the third quarter, up +3% since Q2 and +6% annually, according to the latest Hotspots Index for Q3, 2018. The report charts current buyer demand levels and trends across the UK.
The most notable change was seen in England with a +9% increase in the third quarter, the first time this year the country has seen positive movement. Scotland has seen a slight drop in quarterly demand, but remains up year on year, while Wales continues the previous upward trend of strong demand both quarterly (+7%) and annually (+10%).
London
It’s been a rough ride for home sellers in the capital with demand at 27%, down -1% quarterly and -4% annually.
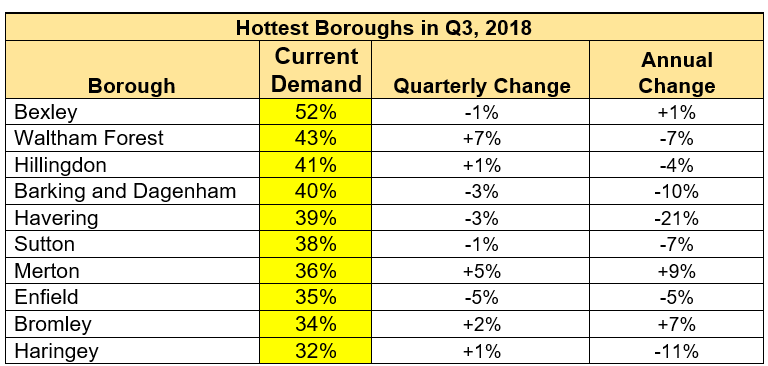
Where current demand is concerned, the boroughs across the capital with more affordable prices lead the way, starting with Bexley at 52% demand.
However, Prime Central London (PCL) seems to be making a comeback with Hammersmith and Fulham seeing a +24% increase in demand this quarter, and even more impressively, an annual jump of +104% – both the highest quarterly and annual change across London.

The Commuter Belt
Despite the greater levels of affordability seeing home buyers head to the commuter belt, demand has dropped off in Q3, down -7% on the previous quarter but remaining static on an annual basis. However, with demand currently at 40%, it is still considerably more in demand than London (27%).
Ashford in Kent has the highest demand this quarter at 53%, down -2% quarterly but up +8% since last year. Since Q2, Brentwood has seen the largest positive change in demand across the commuter belt but it’s the 8th highest increase annually. When it comes to annual change, Waverly in Surrey has enjoyed the largest increase in demand along the commuter belt into London, up +32%.
UK Cities & Towns
Despite the uplift as a whole across the UK, demand in the UK’s 150 largest cities and towns has cooled by -3% quarterly and -5% annually.
The City of Edinburgh tops the list for most in demand in the third quarter at 59%, up +5% in the last year. Essex’s Brentwood saw the most impressive quarterly demand change at +33%. Going back north, Durham enjoyed the largest annual change in demand with a +60% increase.
Newport is the hottest city in Wales with 55% demand this quarter, a +16% rise in demand since last quarter and a jump of +44% over the last year – the fourth largest annual increase in the UK.

Russell Quirk, founder and CEO of Emoov.co.uk, the company that made the index possible, said that: “The numbers this month make welcome reading for home sellers in England, as demand is finally on the up again along with the UK’s as a whole.
It’s the first time this year that we’ve seen UK demand driven by the English market while London and perhaps more surprisingly, the commuter belt both take a back seat.
The commuter belt has been very hot for quite some time now and this consistently high demand has inevitably pushed prices up. However, this static level of demand is nothing more than a natural market adjustment, perhaps exacerbated by current market conditions, but certainly nothing to worry about in the long term.
As always, there are a wealth of areas where buyer demand levels remain very healthy and home sellers should be reassured that any wider national picture of a slower market won’t impact a sale in these areas. In fact, these are the areas where the gap in price expectations between asking and sold price are far narrower and in many cases, sellers can expect to achieve above market price.”
HedgeThink.com is the fund industry’s leading news, research and analysis source for individual and institutional accredited investors and professionals


