Last week we looked at how the return to drawdown statistic can be used to compare different trading systems.
This week real investment account performances will be used to compare their results with bMAMS.
For this example 5 different investment systems are compared.
- bMAMAS
- S&P500
- Managed Fund 1
- Managed Fund 2
- Managed Fund 3
The statistics for the 3 managed funds are taken from Morningstar Research from their list of the best-performing funds. The returns are for the financial year July 2021 to June 2022.
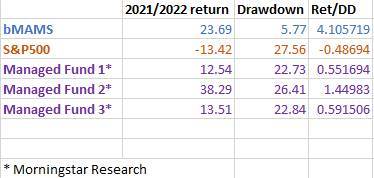
Here is the matrix of the systems- the returns, drawdowns and return to drawdown statistic:

Managed Fund 2 returned nearly 40% for the 21/22 financial year, almost twice as much as bMAMS.
However the drawdown Fund 2 required to achieve these returns is nearly 500% higher than bMAMS. This is why the Return/Drawdown ratio allows an excellent comparison.
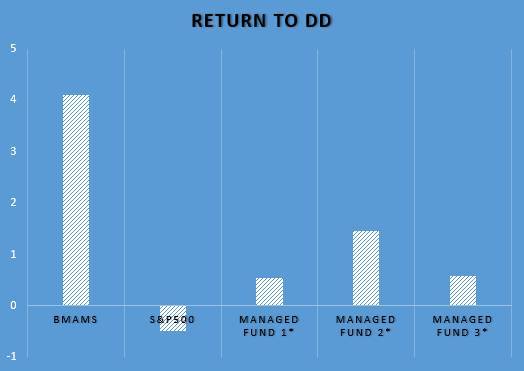
Graphically represented the return to drawdown (ret/DD) of the different investments appears like this:

Using the simple ret/DD statistics the difference in relative performance can be seen.
bMAMS is very sensitive to risk and we keep our risk levels very low. While other systems have at times lost investors more than 20% of their balance, bMAMS has kept these losses at 6%. Even during the difficult 2022 trading year, we have a positive return and a low drawdown.
When the risk is kept low, investors can be comfortable waiting for favourable trading conditions to return knowing that there are no significant drawdown losses that need to be recouped before profits can be made.
bMAMS makes no apologies for our conservative nature towards risk- as our results compare favourably to the best managed funds when return to risk is considered.
Originally posted on https://www.bmams.com.au/
The post bMAMS: How Does bMAMS Returns Compare? first appeared on trademakers.
The post bMAMS: How Does bMAMS Returns Compare? first appeared on JP Fund Services.
The post bMAMS: How Does bMAMS Returns Compare? appeared first on JP Fund Services.


