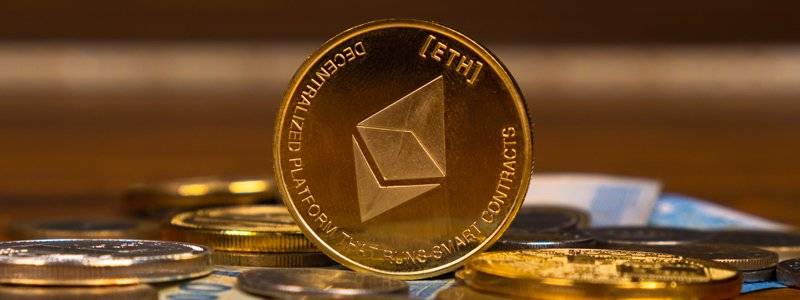
Digital Assets have seen some impressive bullish run in the new month, and this is the time smart investors are making critical decision. This report guides you with the facts and figures of crypto performances last week and furnishes you with the right predictions going forward.

Bitcoin (BTC)
At beginning of last week, November 29, Bitcoin price auctioned at $16,419 as the bulls and bears were sparring over the mid $16,000 level on smaller time frames. The BTC price had witnessed a 3% decline and printed a higher low at $15,995 the weekend before. As November closed, it was best to zoom out from smaller time frames and look at the bigger picture. As at the beginning of the week, Bitcoin price was down 20% from where it began in November.
Bitcoin (BTC $17,087) attempted to flip $17,000 to support on Dec. 1 after sealing its lowest monthly close in two years.
However, Bitcoin gained inch up as November ended. The pair managed to avoid losses as the monthly candle closed, instead seeing solid daily gains of around 4.5% for Nov. 30. Nonetheless, Bitcoin shed 16.2% for the month, making November 2022 its worst since 2019.
Bitcoin price currently trades at $16,945. The bulls have produced a daily closing candle stick back into November’s trading range. Still, investors should remember November’s monthly candlestick closed bearish 16% below the opening price at $17,163.64
As the new begins, the bulls start with the potential to rally higher, but analysts speculate that resistance will likely kick in near the broken support levels near $18,250 levels. The uptrend scenario is thus capped at a 9% increase from the current market value. A weekly close above the aforementioned level is needed to forecast higher targets.
As of December 2, the countertrend hike towards $18,205 remained in play so long as the BTC price could sustain itself above the previous congestion zone’s midpoint at $16,660. BTC/USD has struggled to hold since the beginning of November 2022. Only one breakthrough lifted prices to the 17994 – 17873 zone but failed to continue and pulled back below 17106-16986.
The recent move from the 16000 – 16220 area has created some hope among technical traders; this could be the final run to break the barrier, but it remains to be seen as BTC/USD consolidates on Sunday, December 4. The price consolidation will likely continue at 17106-16986 until it breaks and takes off or pulls back to the previous support zone indicated on the chart.

Ethereum (ETH)
At the start of last week, Ethereum price was still down 24% on the month despite recovering around 15% since November 22. Ethereum price auctioned at $1,208 on Monday. In the last few months, the ETH price appears to have morphed into a range producing higher lows and lower highs.
By mid-week, Ethereum price was appreciating over 10% on the back of a weaker US Dollar, which in turn popped higher on the back of markets gearing up for a less hawkish Fed. This time there was no buy-the-rumor-sell-the-fact price action but a perfect buying of the rumor and staying in the trade.
ETH has been seen shooting above the low of February 1, 2021 and halted at November’s monthly S1 support level.
Ethereum price retests broken support on the second day of December. Ethereum price hurdled through the mid $1,200 zone on smaller time frames, enticing day traders to continue looking for countertrend scalps. Ethereum price auctioned at $1,282. The uptrend move from the November low puts 20% of the lost market value back into the hands of investors. However, ETH has yet to produce a weekly candlestick close inside or above the recently broken support zone at $1,250. Traders may recall the aforementioned level as it played a crucial role in October’s 40% countertrend rally.
Ethereum price set up a local top after a quick run-up over the last week. This move was followed by a tight consolidation that resulted in a breakdown, allowing sidelined buyers to step up. As a result, ETH is primed for a quick run-up.
Ethereum price inflated by 13% between November 28 and December 2 and set up a local top at $01,309. The consolidation that ensued resulted in a downward breakdown, resulting in a retest of the imbalance, aka Fair Value Gap (FVG). This move is an opportunity for investors willing to add more to their holdings or for the buyers that missed the initial run-up. A resurgence of buying pressure could send Ethereum price to collect the liquidity above $1,350.
Beyond this hurdle, ETH bulls can revisit the four-hour FVG at $1,422. While a local top could form here, the residual bullish momentum could see Ethereum price revisit the $1,500 psychological level.
On the other hand, if the Ethereum price fails to manifest an upswing, it would indicate a weakness among buyers. If this development knocks ETH to produce a four-hour candlestick close below $1,195, it will create a lower low and invalidate the bullish thesis.
Such a situation could allow bears to take control of the Ethereum price and push it down to retest the next support level at $1,073.

Ripple (XRP)
On Monday, November 29, XRP price was the outperforming digital assets among the top 3 cryptocurrencies. The bulls recovered 22% of losses bringing the monthly returns to a 16% decrease in value. XRP price traded s at $0.39. The bulls hurdled the 21-day simple moving average on smaller time frames, which could lead to a shorter liquidity bounce into the October low at $0.42.
On the first day of the month, XRP price flipped above the $0.400 resistance level for the second time over the last week. Influence from Bitcoin, which is in a good position and could continue its bullish move, lowers the chances of a breakdown of the remittance token’s immediate support level. Investors expect the XRP price to continue the uptrend.
On Thursday, XRP price hovered 5% below November’s monthly settle at $0.407. As the price coiled between the 8-day and 21-day simple moving averages, the next move is anyone’s guess. XRP price traded at $0.390 as the bulls neared a descending trend line which acted as resistance throughout November.
Going into the new week, XRP price overcame the sellers at the $0.400 resistance level and flipped into a foothold for the second time over the last week. However, this development consumed bullish momentum, leaving little buying pressure for the further run-up. Adding downward pressure is also the lack of volatility from Bitcoin.
However, starting a fresh week could kick-start a run-up for both Bitcoin and XRP price. In this case, investors can expect the remittance token price to continue the uptrend and revisit the $0.448 and $0.506 hurdles.
Once the buy-stop liquidity above these levels is collected, market makers can decide to flip and convert these hurdles into a support floor. If successful, it could allow for a continuation of the rally and tag the next crucial hurdle at $0.609.
While things are looking up for the XRP price, a spike in selling pressure that breaks down the $0.400 support level will signal weak bulls. If this move is followed by a four-hour candlestick close below the $0.316 foothold, the bullish thesis will face invalidation, leading to a correction in XRP price to $0.288.

Cardano (ADA)
When trading session opened last week, Cardano price was in a conflicting situation. Cardano price had the community watching closely as the price hovered a few ticks away from the newfound monthly low at $0.295. During the last weekend of November, the bulls failed several times to sustain support above the 8-day exponential moving average (EMA). During the New York session on Monday, November 28, the bears forged a firm rejection from the EMA. As the price hovers below the moving average, traders are forced to ask a pivotal question. What price are the bears truly aiming for?
On Monday, November 29, Cardano price traded at $0.306. The rejection from the 8-day EMA showed an uptick in transactions compared to the previous weekend. The rejection was simultaneously at a triangle apex that manifested earlier in the month.
On the last day of the month of November, Cardano auctioned at $0.309, below the most recent swing high at $0.322. The bulls failed their first attempt to hurdle the 8-day exponential moving average, but the rejection has provoked a retest of a trendline that connects the last three swing highs.
Cardano price starts the new month of December by moving away from $0.30, the low in 2022, and is even seeing its price action becoming underpinned. No real bullish breakout has arrived just yet, but rather some small signs are emerging that bulls are slowly but surely flocking into the much-battered cryptocurrency that has received one punch after another ever since FTX collapsed. Trust seems to be getting restored, and the Relative Strength Index (RSI) is still close to the oversold barrier.
SOL thus has room for upside, with the red descending trend line and the new monthly pivot for December coming in around $0.350. It is no coincidence that the 55-day Simple Moving Average is nearly coming in on that same level. A bullish breakout above here would be perfect, but traders must stay focused on the 10% gain they could book if SOL tests resistance in the coming weeks and leave the breakout for next year.
Defining that underpinning and that lowest level for 2022 at $0.296 becomes a target on the back of ADA bulls. Bears will gladly try to use some surprises in economic data numbers that could point to higher inflation to run price action back into the ground. Should $0.296 break and print fresh lows for 2022, expect to see possibly a full meltdown toward $0.200, a pivotal level for November of 2021 and bearing a 35% devaluation.

Solana (SOL)
Solana (SOL) has been flirting with $10 to the downside and since the third week of November. At the end of the month, Solana (SOL) price was set to stage one of its best performances for the year, and that could also be for the trading day or throughout several trading days in a row.
Solana price showed massive signs of recovery from a purely technical point of view. Looking at the preferred measure of sentiment – the Relative Strength Index (RSI) – it became clear that the upside was the only way. Going into the new month, SOL is primed for a jump toward the first $15.07, which is the cap level for most of November.
Solana price was a crypto underperformer throughout November. While several cryptocurrencies produced decent-to-jaw-dropping countertrend rallies, the Solana price remained suppressed. As the SOL price hovers 20% above the newly established yearly low at $10.94, the technicals suggest the centralized smart-contract token could fall further.
At the beginning of the new month, Solana price auctioned at $13.54. The bulls failed on three separate occasions in November to hurdle above the $14 zone. A Fibonacci retracement tool surrounding the 65% decline shows the $14 zone as just a 23.6% retracement. Amongst Fibonacci swing traders, the aforementioned level is not considered a strong confluence zone. In other words, the 23.6% level is usually breached as most Fib practitioners consider the 38.2%, 50% and 61.8% levels as magnet-like targets.
The bulls will need to challenge the candlestick that brought the SOL price into the current range to invalidate its bearish potential. A breach of the candle’s closing price at $16.45 would create further opportunities for the bulls to climb higher. Potential targets would be the 38.2% and 50% Fib levels at $17.86 and $20.72. The sol price would rise up to 56% if the levels were breached.
Digital Asset Insights
Digital Asset Insights #95
first appeared on trademakers.
The post Digital Asset Insights Digital Asset Insights #95 first appeared on JP Fund Services.
The post Digital Asset Insights Digital Asset Insights #95 appeared first on JP Fund Services.


