


Equity market volatility and regional performance
In January and February, listed equities and bonds across global markets grew significantly, reflecting increased investor participation and new bond issuance by governments and corporations. The gains in private markets, private equity, private debt, real estate, and infrastructure contributed to this growth.
However, March has witnessed a sharp downturn, particularly in US equities, which accounted for 93% of the $4.0 trillion decline in global equity values. The US market alone has shed $2.3 trillion in value year-to-date, driven by falling share prices of major companies.
Despite this, several markets have remained resilient. European equities (excluding the UK) have grown by $1.4 trillion year-to-date, while the UK market has added $193 billion, largely due to rising share prices and a weaker dollar. Asian equities, led by China and Hong Kong, are up $218 billion, whereas markets in India, Japan, and Taiwan have seen a decline in the same period.
Impact of US trade policies on capital flow
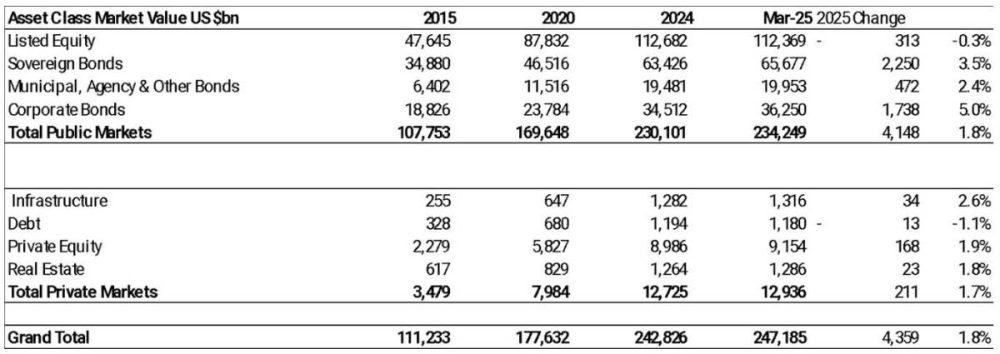
The current downturn is primarily driven by US trade policies, which have triggered capital outflows from US equities into European and Asian markets. Ocorian’s data indicates that by mid-March, global listed companies had lost $313 billion in value year-to-date, with the US market responsible for the majority of these losses.
Commenting on the situation, Jason Gerlis, Head of Americas and Global Head of Corporate Services at Ocorian, stated:
“Asset prices have whipsawed in 2025 in the face of concerns over government finances and the inflationary impact of US trade wars. But it’s US assets that are feeling the most pain, as a flood of capital out of US equity markets is washing up on shores in Europe and parts of Asia. Six of the US Magnificent 7 stocks have lost $2.3 trillion of value since the New Year. This highlights how important diversification is. The growing concentration of stock market value in the US and among a few companies – the fifteen largest companies account for one-fifth of the global total – is increasing risks for investors.”
Bond markets see growth despite market volatility
While equity markets have faced turbulence, bond markets have expanded significantly in 2025. Year-to-date, global bond markets have grown by $4.5 trillion (3.8%), primarily due to new bond issuance by governments and corporations, as well as a weaker US dollar.
Ocorian’s data suggests that bond markets have played a stabilising role, absorbing some of the capital that has exited equities. In March alone, bond markets grew by $985 billion, reflecting increased investor demand for more secure investments amidst rising uncertainty.
Private markets continue to expand
Private markets, though experiencing some decline in March, remain up 1.7% year-to-date, reaching a total valuation of $12.9 trillion. This growth has been primarily led by private equity, particularly in Europe and the US, and a recovery in real estate markets.
Despite a $326 billion decline in March, private assets remain a key component of the global asset landscape. Over the long term, private markets have outpaced public markets in growth, expanding 656% since 2009, compared to public markets, which have grown 3.3 times over the same period.
Gerlis further highlighted the growing role of private markets in global investment trends,
“Private markets can help investors achieve this much-needed diversification. Private capital is transforming the way businesses grow. Public markets have long provided a structured path for companies to raise capital and investors to earn returns, but their reach is far more limited than their size suggests. And the vast majority of companies are still privately owned – around 90% in the US for example. Investors and businesses alike are seeking alternative paths to growth, and private capital is increasingly the bridge between opportunity and execution. The global investment landscape is shifting rapidly – the dramatic growth in private assets reflects both a flow of capital to the sector and superior performance over the long term.”

UK market performance
The UK market has demonstrated strong resilience in 2025, with listed assets rising by $338 billion in January and February to reach a record $7.5 trillion. This 4.8% growth has outpaced the global average, driven largely by higher share prices and bond market expansion.
In March, UK assets saw only marginal changes, with lower share and gilt prices balanced by growth in the corporate bond market and a stronger British pound. By mid-March, UK listed assets had risen by $354 billion year-to-date, contributing positively to global asset values.
About Ocorian
Himani Verma is a seasoned content writer and SEO expert, with experience in digital media. She has held various senior writing positions at enterprises like CloudTDMS (Synthetic Data Factory), Barrownz Group, and ATZA. Himani has also been Editorial Writer at Hindustan Time, a leading Indian English language news platform. She excels in content creation, proofreading, and editing, ensuring that every piece is polished and impactful. Her expertise in crafting SEO-friendly content for multiple verticals of businesses, including technology, healthcare, finance, sports, innovation, and more.


